Prism Central
Open https://<Prism-Central-IP>:9440
Fill out the following fields and click Enter:
- Username - admin
- Password - HPOC Password
After you log in to Prism Central, familiarize yourself with the Prism UI.
Explore the information on the Home screen:
- Cluster Runway
- Cluster Quick Access
- Impacted Cluster | Alerts
- tasks
Review the Explore screen:
- VMs
- Images
- Clusters
- Hosts
- Disks
- Storage Containers
Review the other sections, and do a quick walk through:
- Planning
- Analysis
- Apps (We will configure this later in the workshop)
- Alerts
- Tasks
- Search
- Help
- Configuration
- User
Prism Central UI Review
How would you find the screen that shows you a table of all the hosts managed by an instance of Prism Central?
Note
If this Prism Central instance was managing multiple clusters, this screen would show the hosts for all of the clusters being managed.
In Prism Central > Explore, click Hosts on left-hand menu.
How would you find the screen that lists all of the VMs currently deployed. This screen looks similar to the figure below?
In Prism Central > Explore, click VMs on left-hand menu.
What page would show you the latest activity in the system? On this page, you can monitor the progress of any task and keep track of what has been done in the past using time stamps. Can you figure out two different ways to get there?
First Way, In Prism Central > Home, click View All Tasks. Second Way, click
Note
In ESXi:
- vCenter Server instances can be registered to Prism via Prism’s icon.
- Registering a Nutanix Cluster running ESXi with vCenter allows to perform core VM management operations directly from Prism without switching to vCenter Server.
- The vCenter Server that is managing the hosts in the cluster is auto-discovered and its IP address is auto-populated in the Address field as shown in the example below.
Example view of vCenter registration to Prism:
- <<<<<<< HEAD
-
Prism Element
From the Firefox web browser (preferred), log into the Nutanix Prism GUI using the Cluster IP.
Open https://<NUTANIX-CLUSTER-IP>:9440
Fill out the following fields and click Enter:
- Username - admin
- Password - HPOC Password
After you log in to Prism Element, familiarize yourself with the Prism UI. Explore the information on the Home screen, as well as the other screens.
Review the Home screen, and identify the following items:
- Hypervisor
- Version
- Hardware Model
- Health
- VM Summary
- Warning Alerts
- Data Resiliency Status
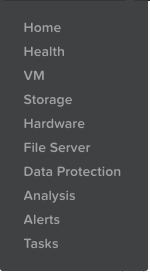
Review the UI navigation options.
Examine the cluster hardware by using the navigation menu, and go to the Hardware.
In Prism > Hardware, click Hardware, then click Diagram.
Review the hardware summary information:
- Blocks
- Hosts
- Memory
- CPU
- Disks
Review the other sections, and do a quick walk through:
- VM
- Health
- Network
- Data Protection
- Storage
- Alerts
- Etc.
Review other sections of the Prism UI
- Health
- Alarms
- Tasks
- Search
- Help
- Configuration
- User
Prism Element UI Review
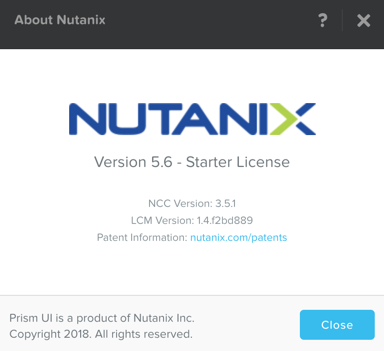
Where would you locate the version of AOS you are running?
You can do this by clicking on the User drop down , and clicking About Nutanix.
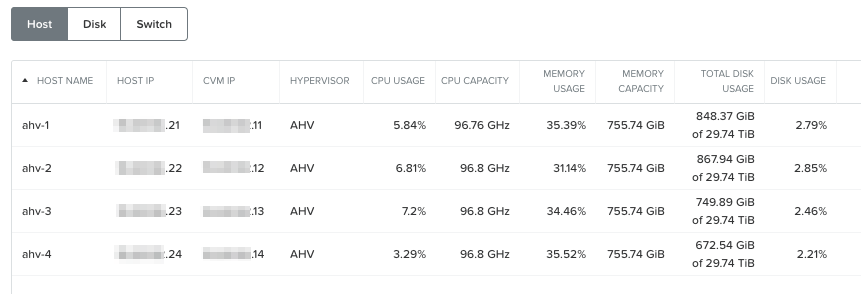
How would you get to the following screen to view a summary of the number of hosts (or nodes) and the resource capacity and current utilization?
In Prism > Hardware, click Hardware, then click Table.
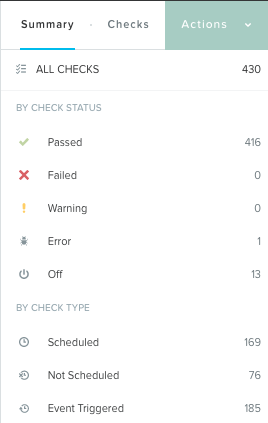
How would you get the following screen to see the health of your cluster?
In Prism > Health, click Health, then click Summary in the right pane.
What page would show you the latest activity in the system? On this page, you can monitor the progress of any task and keep track of what has been done in the past using time stamps. Can you figure out two different ways to get there?
First Way, In Prism > Tasks, click Tasks. Second Way, click .
Note
In ESXi:
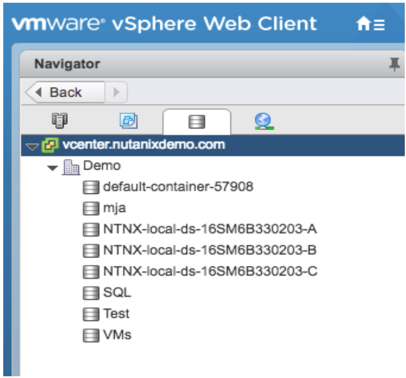
- The containers created in Prism appear as datastores in vCenter.
Example view of storage containers from Prism:
Example view of storage containers (datastores) from vCenter: